Data Mapping: Reporting
Introduction
In this tutorial, you'll explore your Data Map, filter the Map and Table views, and export a report. By the end of this tutorial you will be familiar with Fides' Data Map visualizations, filters and report exports.
Prerequisites
For this tutorial you will need:
- A Fides Cloud or Fides Enterprise account
- The role of
Owner,ContributororViewerfor your Fides organization.
Exploring the Data Map
There are two views for exploring the Data Map in Fides. The Map view and the Table view. Let's review each briefly:
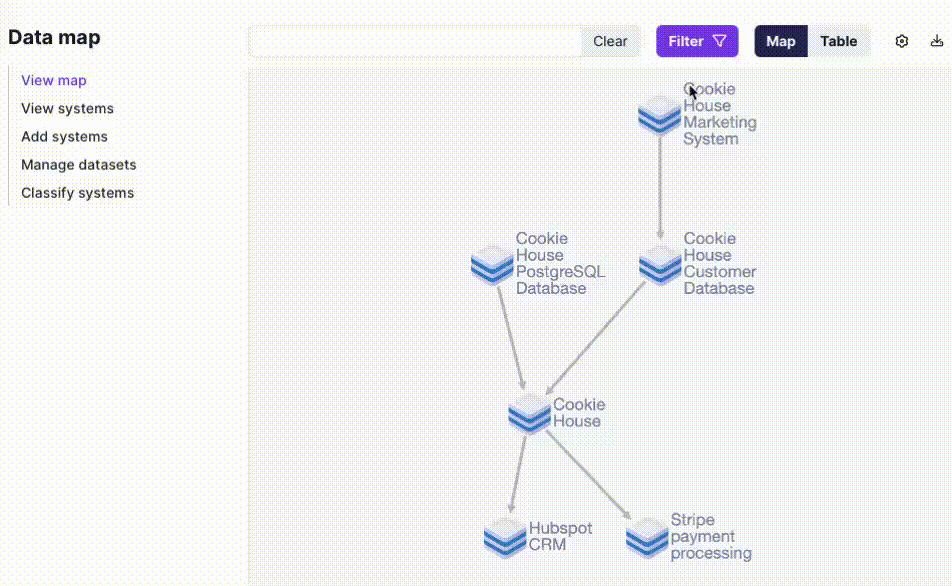
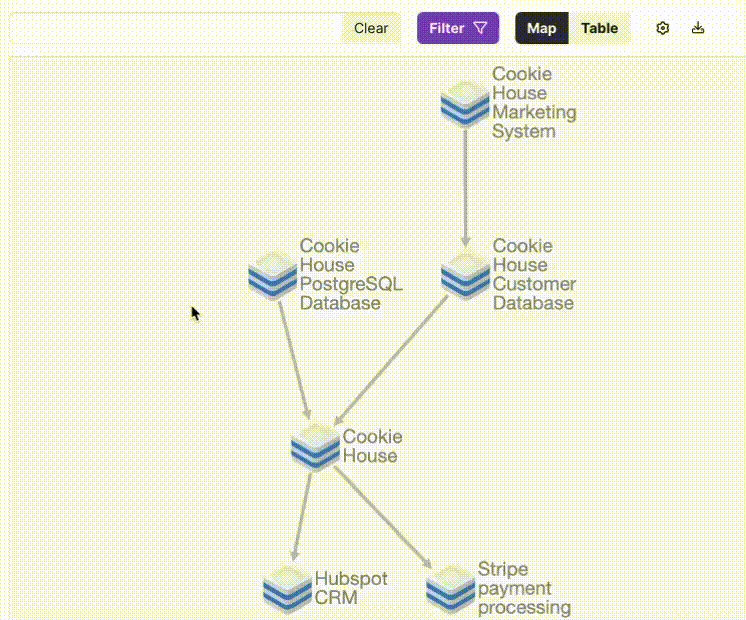
Map View
The map view is a visual graph of systems and data flows across your organization. The map view is ideal for investigating risks or reviewing exceptions and issues that you are alerted to by Fides.
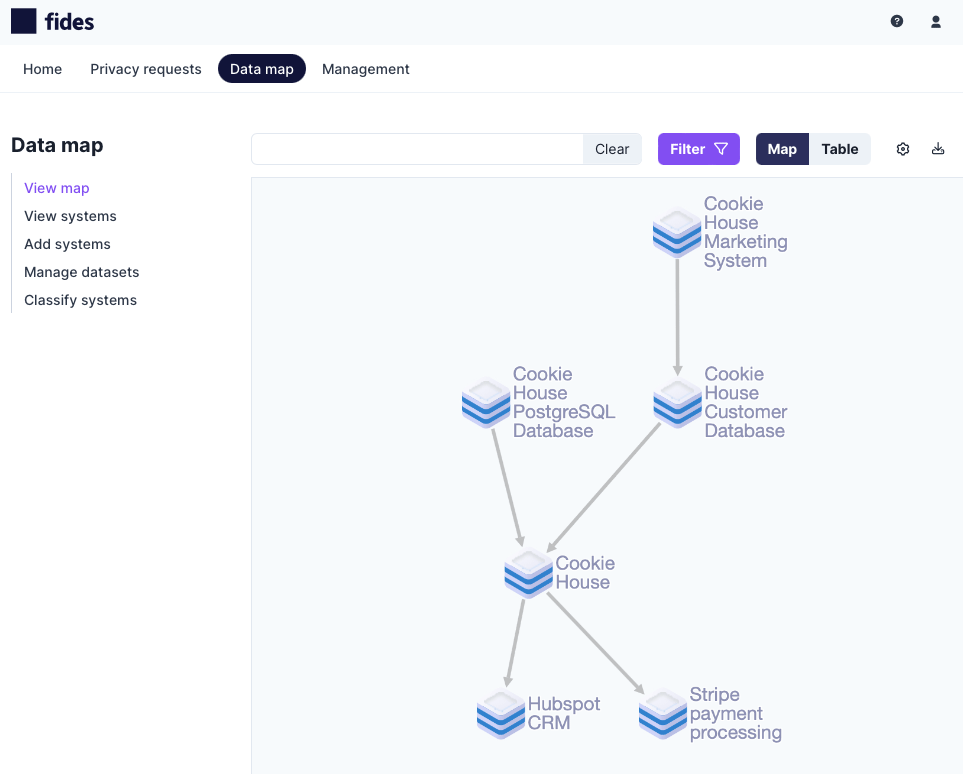
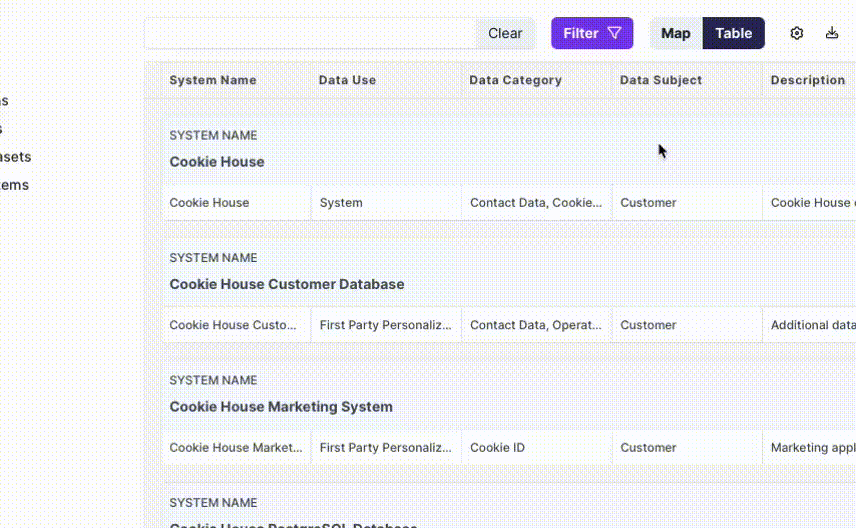
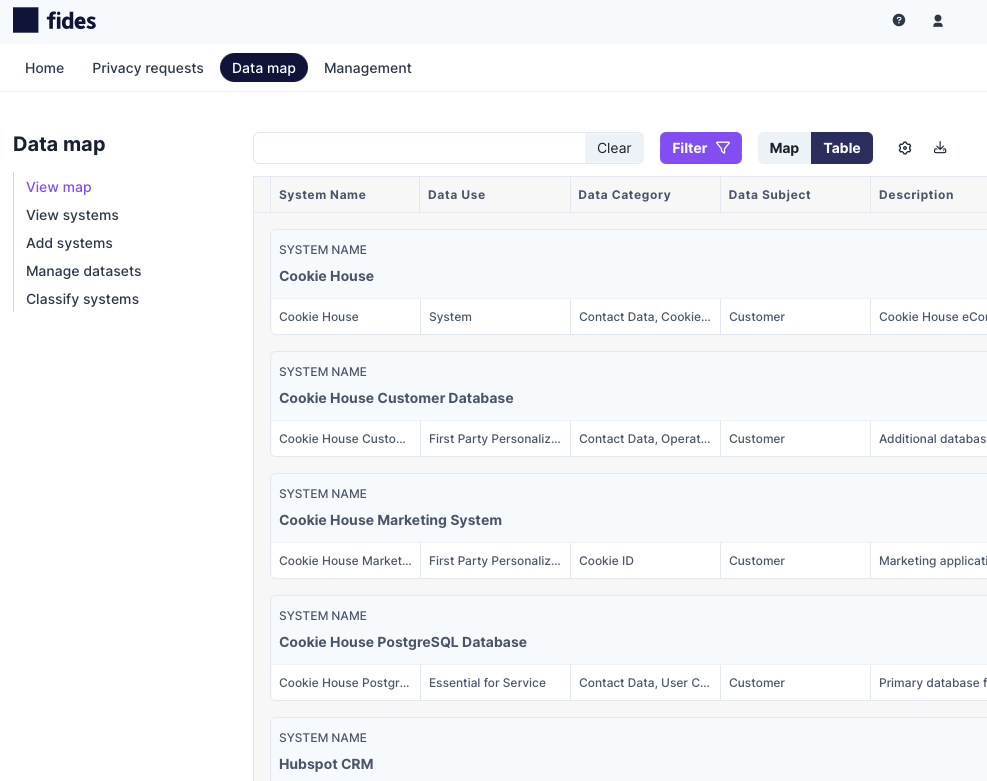
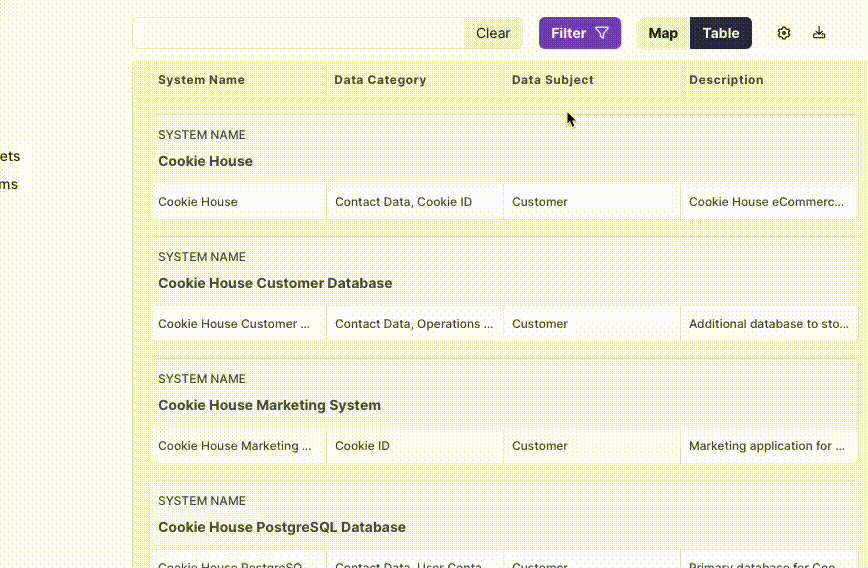
Table View
The table view is a grouped, tabular view of your systems ideally suited to filtering and building exportable reports based on specific regulations or information requirements.
Both the map and table views share search, filters, settings, system details and export functionality. This means that any search term, filter or setting applied in one view will affect the other if you toggle from Map to Table views.
We'll briefly review the option available on both the Map and Table views:
Search for Specific Systems
Search will return systems based on the keyword provided for both the map and table view. Search interrogates all attributes of a system, including the name. For example, you can search for a specific system by name, such as "customer support system", or you can search for the use of data, such as "email marketing". As shown in the example below:
Filter by Privacy Attributes
You can filter the both the map and table view by selecting the filter options and checking the attributes to narrow the view to your requirements. For example, to filter the data map by systems that perform email marketing and process email and names, check those options, as shown in the example below:
View Detailed System Information
Simply click on any system on the map or table views to see detailed system information. Clicking on a system reveals the system tray which contains information such as descriptions, data use as well as data sources and destinations. If you have sufficient permissions you will also be able to edit or update system information from the system tray.
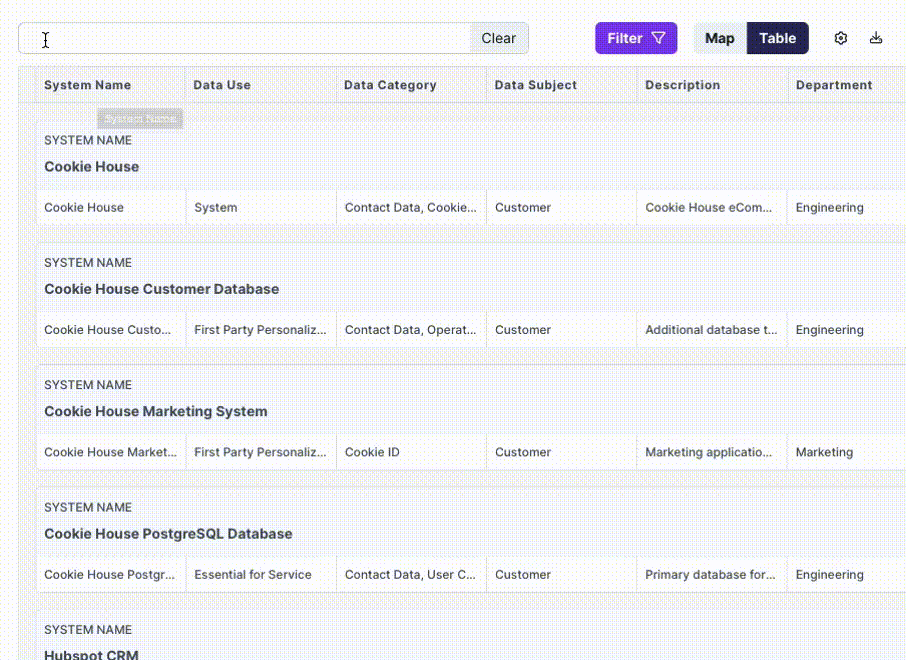
Select Columns to Display
On the table view you can also filter columns that are displayed. Colums that are shown on the table view are also applied to exported reports. This makes it easy to quickly toggle which columns you would like to view and then export a report as required.
Export Reports
To export a report of the current view, click the "Download Report" button and select from the available options.